COMPUTATIONAL FLUID DYNAMICS for micro-scale assessments
Key features of micro-scale modelling
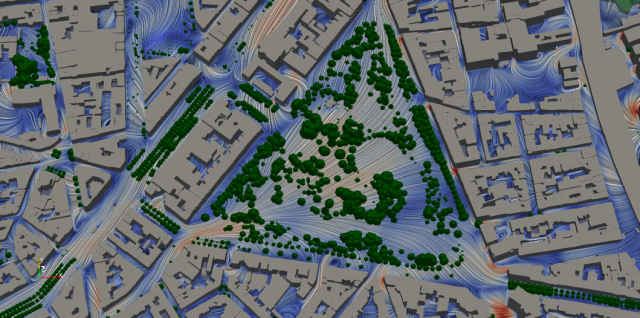
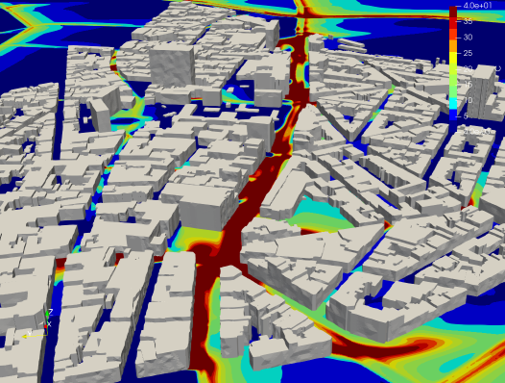
- The models offer the opportunity for micro-scale assessments of the most challenging environments, such as urban tunnel portals combined with high-rise buildings and industrial sites. And they allow focusing on the relationship between air quality, urban vegetation and urban climate.
- An inhouse developed Python package supports the application of the OpenFOAM software via automated meshing and pre- and postprocessing of results.
- Via an online dashboard modelling results can be made available to end-users to visualization and further analysis.
Industrial sites
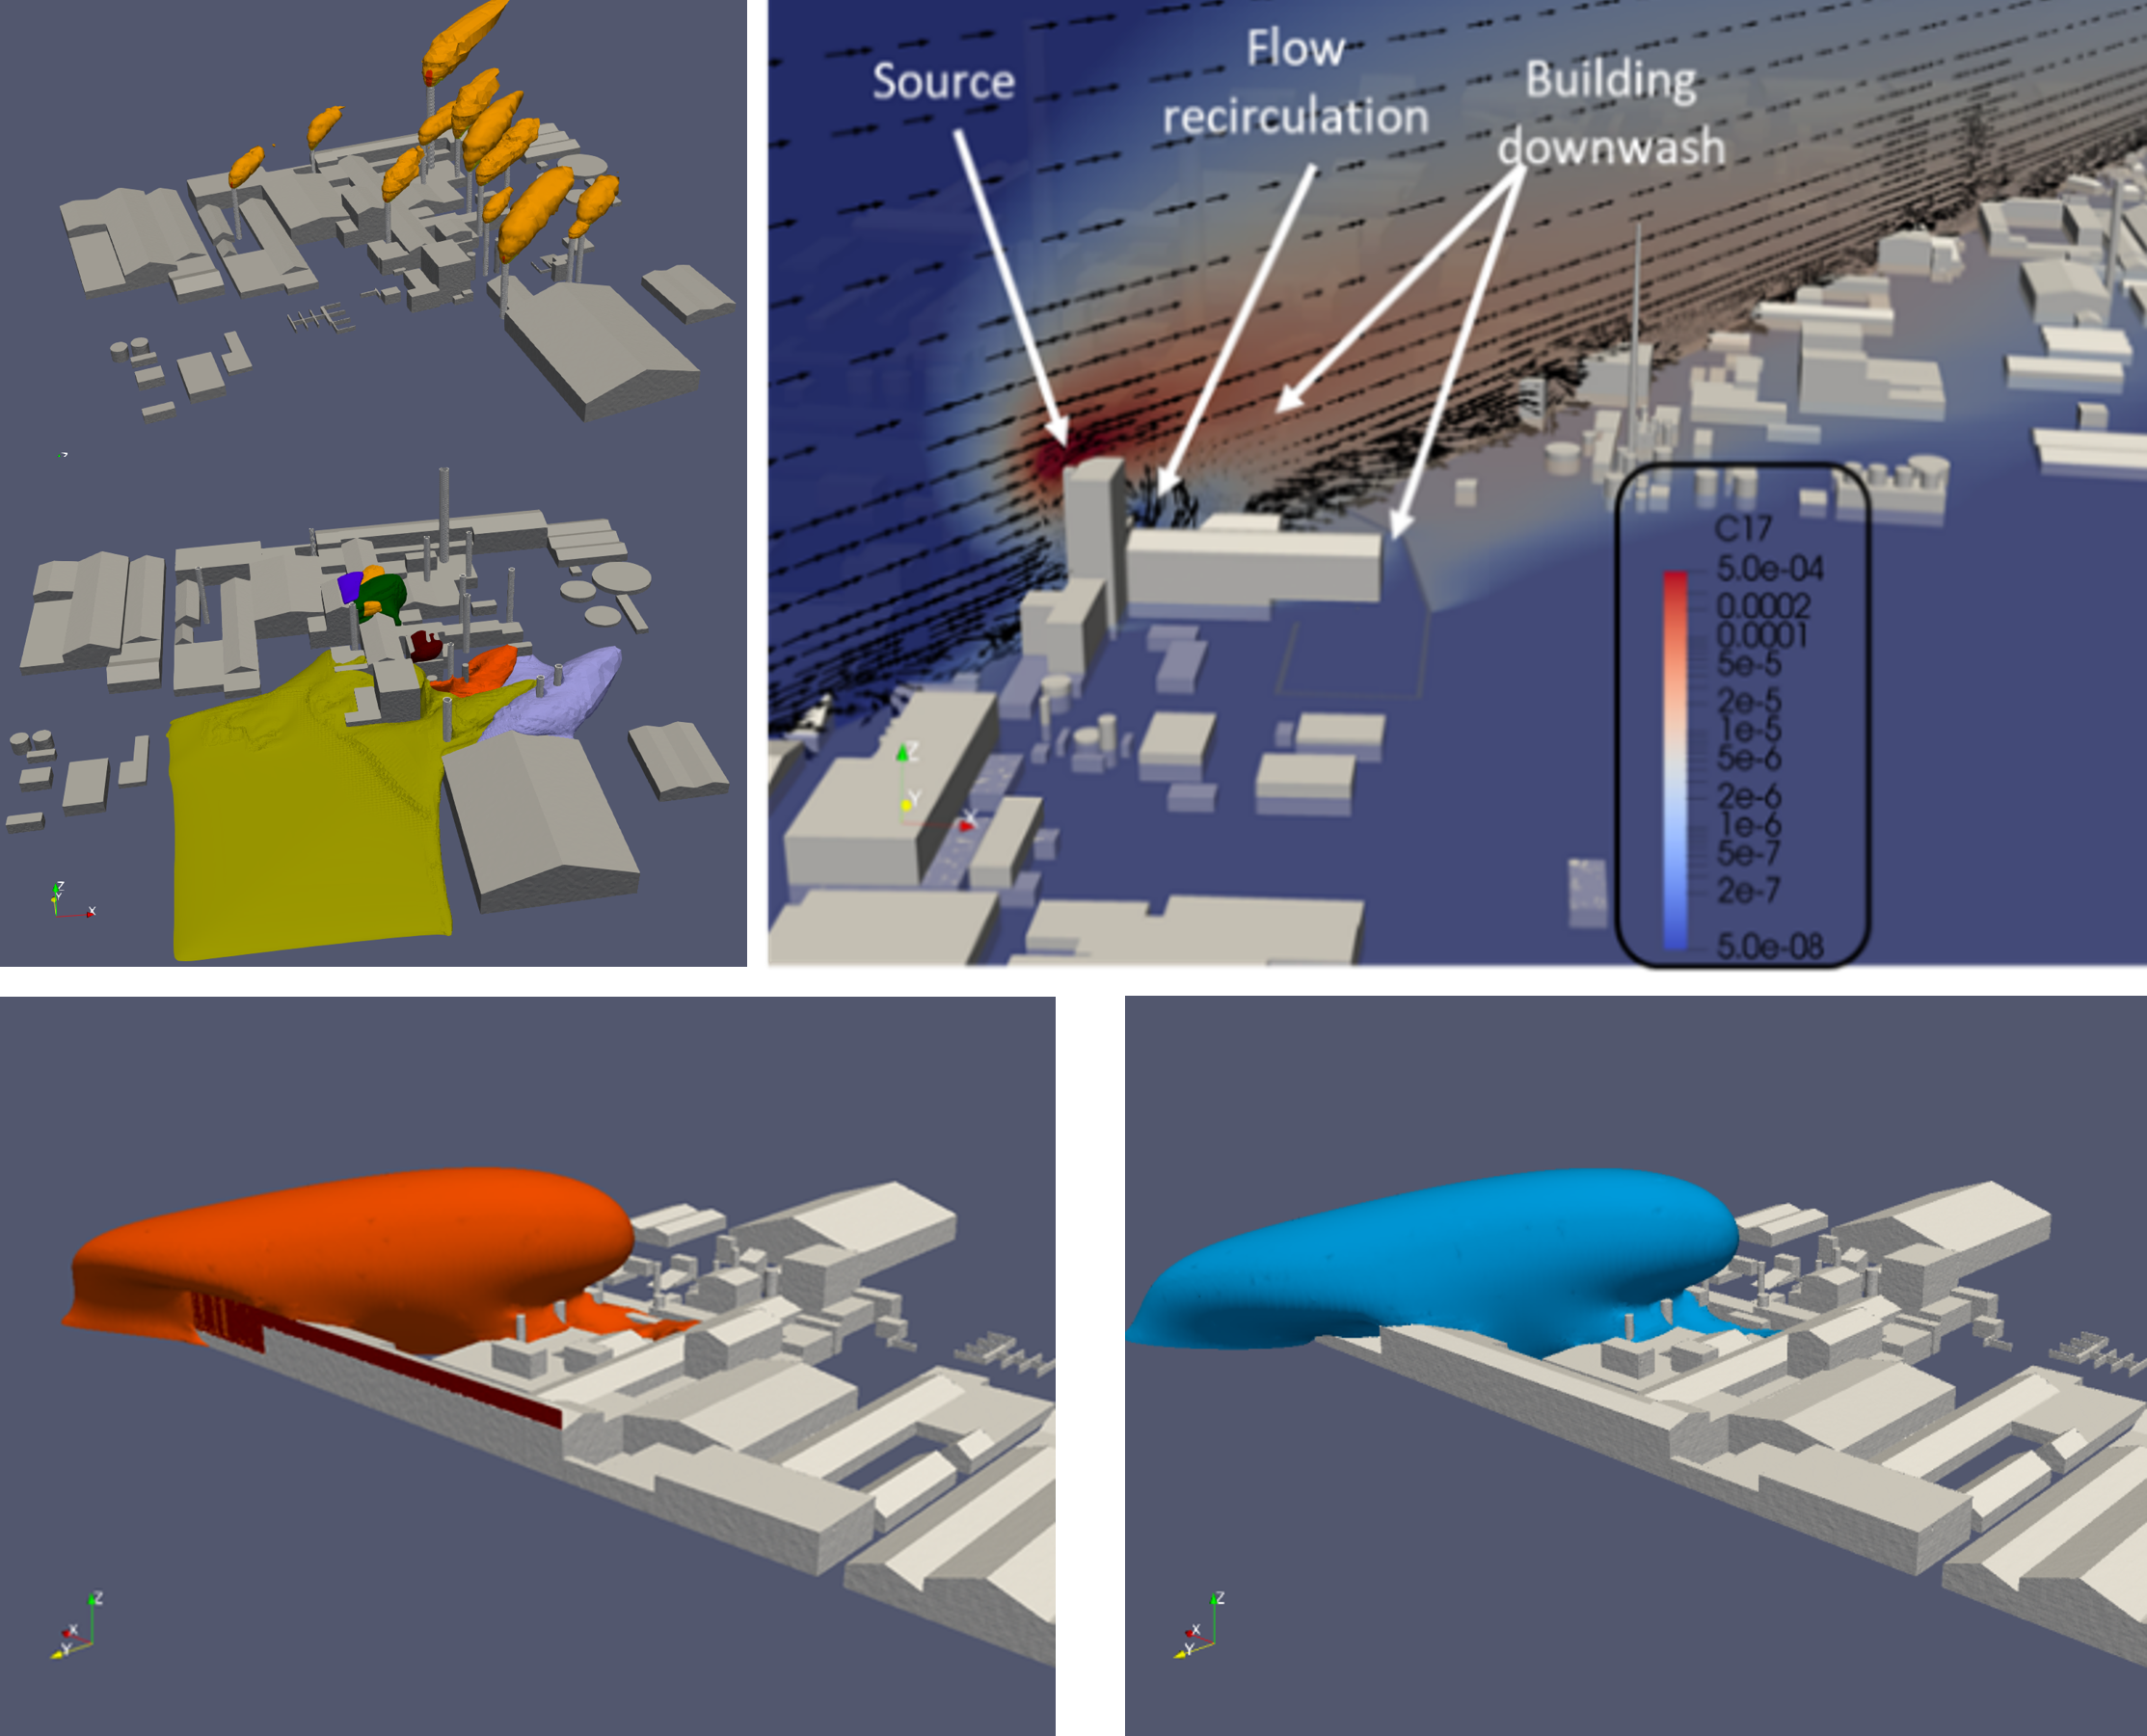
- Industrial sites are a challenging problem due to both stack emissions and non-guided emissions at ground level.
- CFD is used to model guided and non-guided emissions considering the 3D features of the industrial site
- Such level model detail allows for a detailed analyses of building downwash, pollution entrainment, and mitigation features
Tunnel outlets
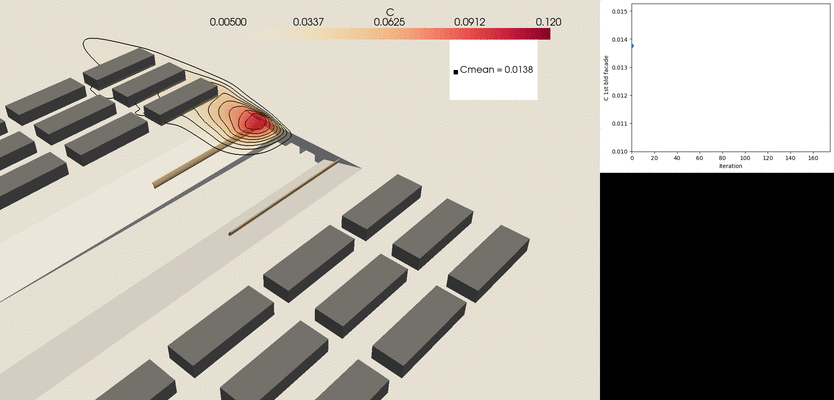
- Tunnel outlets remain a relevant pollution hotspot in urban areas
- To address this, VITO’s CFD package is linked with a fully automatized shape optimization methodology to extract the optimal location and shape of the pollution barriers.
- The CFD model has been used to develop design guidelines of different features that can be easily applied to engineering problems.
Non guided emissions
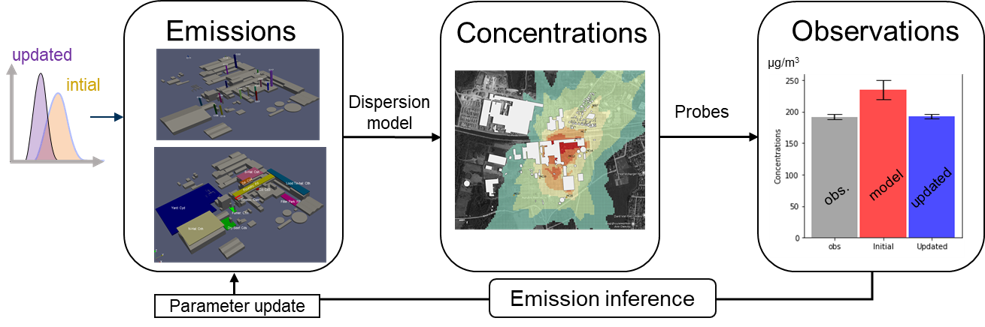
- Non guided emissions are typically difficult to quantify. The CFD model is applied in a reserve dispersion modelling (RDM) chain to estimate emissions strengths.
- The CFD mode is linked to a Bayesian inference methodology that extracts information from a network of sensors to estimate unknown sources. Both sensor and model uncertainties are taken into consideration.
Interactive dashboards
- Interactive dashboards are used to show and analyse the CFD results by the clients.
- The dashboards are used to compare on the fly different plant configurations with different emission scenarios.
- Forecast of pollution patterns are provided along with the option to analyze and visualize the impact of changes in emission values.