E-MAP (or Emission-MAPper) is the beating heart of the VITO emission modelling activity. The model spatially allocates the officially reported emissions in a standardized way which can be used by different types of air quality models. The calculations are currently focused on the Flanders region, but results are available for the whole of Europe.
The flowchart below shows the general logic behind the E-MAP emission model. Many of the bottom-up sectoral models are developed, supported, or managed by the VITO emission experts.
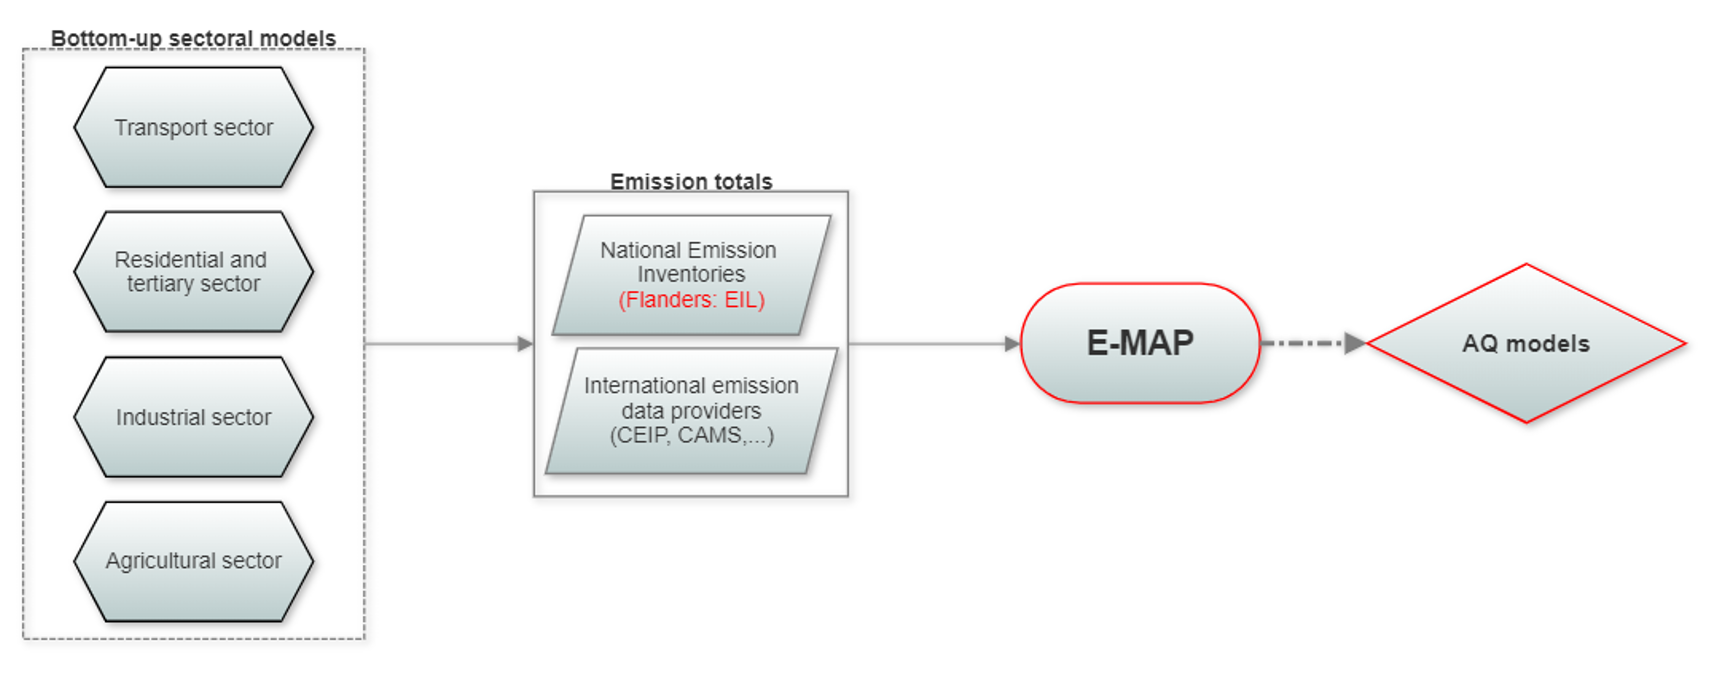
E-MAP Flow
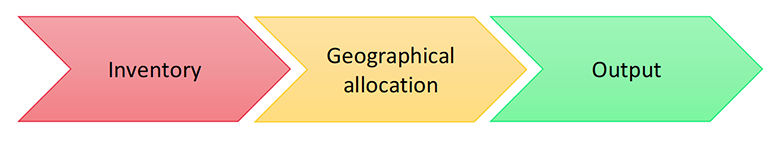
Input
E-MAP starts from the national emission inventory datasets. It is designed to work with the most detailed and recent data. When separate and reliable point source data is available, it is included in the model. Built-in control mechanisms ensure the highest quality of the data.
Extra detail available in the respective sectoral models developed or managed by VITO, is incorporated in E-MAP. The model is set-up in a generic way to incorporate the same level of detail for the rest of Europe when inputs become available.
Core calculations
The current version of E-MAP uses spatial patterns for the different pollutants per sector. The methodology allows to use a separate spatial pattern for each region in the model. The following sources are currently used:
- For Flanders: the Flemish Emission Inventory, EMAV, FASTRACE, and EMMOS. Point sources are placed on their exact locations.
- For The Walloon area: TRANSFAIR for classical pollutants and CEIP for the rest
- Other countries: CAMS for classical pollutants and CEIP for the rest
The methodology is specifically designed to work with the best spatial pattern available.
Advantages of the E-MAP methodology include:
- Generalized approach to cope with missing spatial data
- Tailored approach to cope with country boundaries and sea boundaries
- Approach to handle grid boundaries
- Generalized approach for optimal grid resolution
- Method to include sea shipping and related memo items
Output
The output of E-MAP are geographically allocated emissions in a structure that can be used by air quality models. A user has the freedom to choose the type of air quality model, the aggregation level ((G)NFR, SNAP) and the resolution of the output for Flanders (highest resolution is 250m).